TechnologyNovember 18, 2021
Software enables algorithms for condition-based monitoring
In this introduction to the Condition-Based Monitoring Platform (CN0549), the focus is on the software ecosystem, data analysis tools, and software integrations available for the different components, and how engineers and data scientists can leverage them for application development.
When condition monitoring solutions are built, they must contain sensors, local processing, connectivity, and some form of software or firmware to make it all function. The CN0549 addresses all these challenges by providing customizable options for both the hardware and software aspects, so engineers and software developers can make design trade-offs in their applications while using common tools and infrastructure.
For example, if you want to choose a particular microcontroller or FPGA for your processing, prefer to use Python coding, or have a favorite sensor you’d like to reuse. This makes the CN0549 a powerful platform for those looking to build an optimized CbM solution where processing, power, performance, software, and data analysis can be customized to their needs.

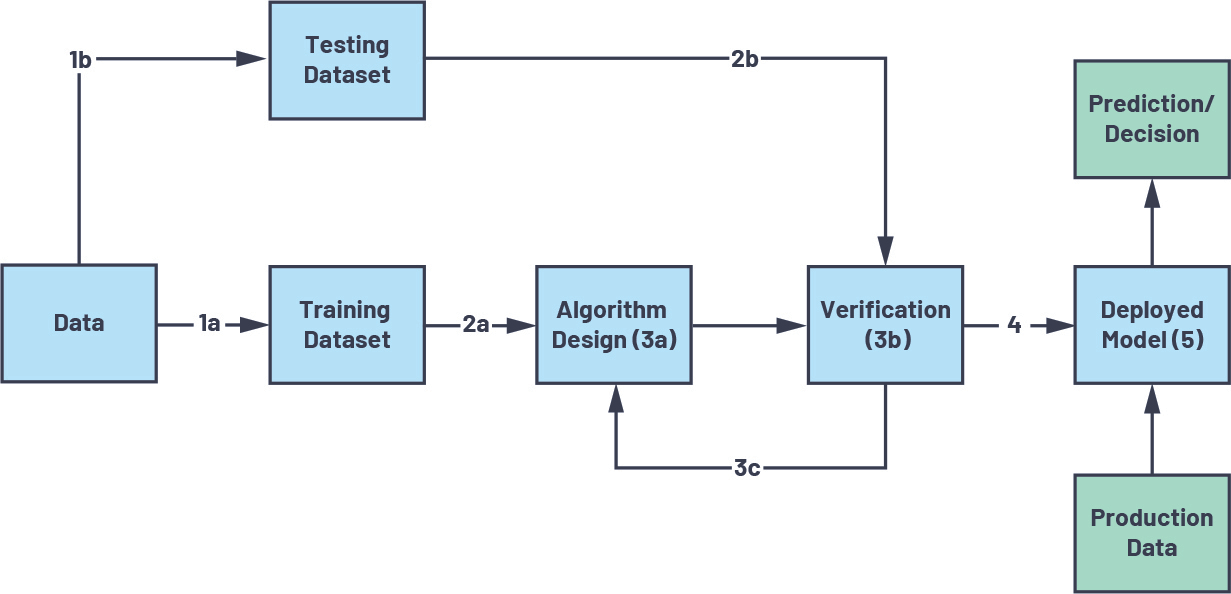
Embedded system development flow.
Embedded system development
Let us consider a common development flow for an embedded system from conception to production. The figure above provides a top-level overview of an abstracted flow.
The first step in the design process shown above is the Data Research phase. In this phase, users map their requirements to the different hardware and software requirements needed for their application. From a hardware perspective, these may be parameters like shock tolerance, analog signal bandwidth, or measurement range. When considering the software requirements, the number of samples, sample rates, frequency spectrum, oversampling, and digital filtering are important parameters for CbM applications. The platform is very useful and flexible, allowing researchers to use different sensor combinations and tune the data acquisition parameters for their own application needs.
Following the Data Research phase is the Algorithm Development phase, where the application or use of the system is proven out. This usually entails developing models or designing algorithms in high level tools that will eventually be ported to the embedded system. However, before optimizing the design, it must be validated using real data and with hardware in the loop, and this is really where CN0549 excels because not only does it provide direct integration with popular high level analysis tools, but it also allows for hardware in the loop validation.
Once the design is proven, the job of optimizing and getting the necessary software components embedded begins. In the Embedded Design Elaboration phase, this can require re-implementation of certain algorithms or software layers to work in an FPGA or resource constrained microcontroller. Great care must be taken to continually verify the design as it is ported onto a prototype or near production hardware for final validation.
Lastly, we arrive at the Production phase, which likely has little resemblance to the original development environment the design began using, but nonetheless still needs to meet the same requirements. Since the final system may have migrated far from the original research system, running the same code or tests may be impossible or extremely difficult. This could lead to production testing issues and unit failures, and likely requires an additional time and money investment to remedy.
Reduce risk by maximizing reuse
One of the easiest ways to reduce risk during the design process is to reuse as many hardware and software components as possible throughout each stage, and the CN0549 provides many resources out of the box for developers to leverage directly in all stages of the development flow.
The CN0549 solution offers schematics and board layout files, an open software stack for both optimized and full featured environments, and integration options for higher level tools like MATLAB and Python. End users can leverage validated components from ADI and choose the pieces they want to maintain or change as they move from research to production.
This also allows end users to focus on algorithm development and system integration rather than schematic entry with ADI parts or ground up software development. Leveraging hardware modules and reusing software layers, such as device drivers, HDL, or application firmware, from ADI reduces the development time required to build a system and can drastically accelerate time to market.
Development flows and processes
The CN0549 offers engineers a myriad of choices during development, allowing them to work in common languages, including C or C++, while using data analysis tools they are experienced with, such as MATLAB or Python. This is primarily done by leveraging and building on top of open standards, as well as solutions that support multiple embedded platforms from different manufacturers.
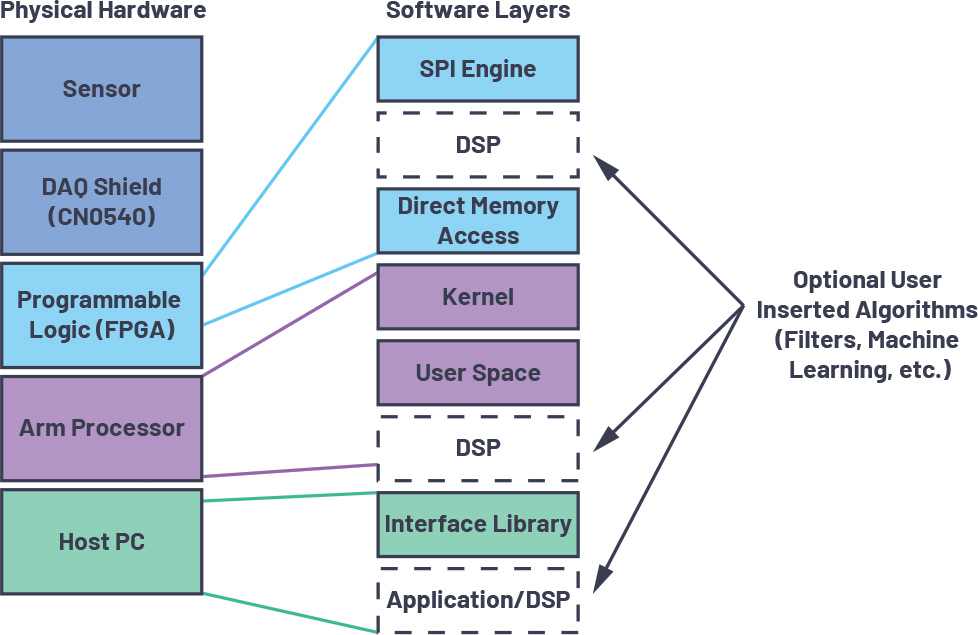
System stack of the CN0549 platform.
CN0549 system stack
The system stack provides the basic overview of the different components comprising the CN0549 system. In the dark blue boxes on the top left are the sensor and data acquisition (DAQ) board, while the light blue and purple boxes outline the FPGA partitions used for the data processing.
The platform directly supports the Intel DE10-Nano and the Xilinx CoraZ7-07s, covering both major FPGA vendors. The green box represents the connection back to the host PC. This provides direct data access from the hardware to the high level data analysis tools for algorithm development.All of the hardware description language (HDL) code is open source, which allows developers to make modifications to insert digital signal processing (DSP) into the data streams within the programmable logic (PL). This could be anything from filters to state machines, even machine learning, and depending on your system partitioning, this step can also be done in the user space or the application layer. Since the code is openly available it could be ported to other FPGAs from different manufacturers or to different processor families depending on your end application needs.
Inside the Arm processor there are two software options. Their use will be dependent on use case and both likely will be used by most developers:
Linux: In-kernel drivers are provided for the DAQ shield built within the input output industrial (IIO) framework within the kernel. This is coupled with a full embedded Linux distribution called Kuiper Linux, which runs in the Arm core user space and is based off the Raspberry Pi OS.
No-OS: A bare metal project is provided with the same drivers used in the Linux kernel, which would be used with Xilinx’s or Intel’s SDKs. This can also be implemented into a real-time operating system (RTOS) environment as an alternative implementation.
It is recommended that developers start in Linux to learn and begin development with their system, since it provides the largest amount of tooling. Linux also provides an enormous number of packages and drivers, making for a desirable development environment. Once the system design is stable and ready for optimization, it is common to switch to No-OS and only ship the software that is necessary. However, this is highly application dependent and many will ship full Linux systems due to the flexibility they offer.
Like the HDL for the programmable logic, the entire kernel source, Kuiper Linux image, and No-OS projects are completely open source, which allows end users to modify any component as they wish. These code bases can also be ported to different processor systems if desired or different runtime environments.
The last component of the system stack is the connection to the host PC, which is shown in the green box. When running the system, the devices can be configured, and data streamed backed to a host system for analysis where developers will create algorithms on their host machines leveraging standard tools like MATLAB or TensorFlow. Then shift those algorithms eventually to the embedded target, allowing them to use their local processing power for faster algorithm development iterations.
Accessing CbM Data
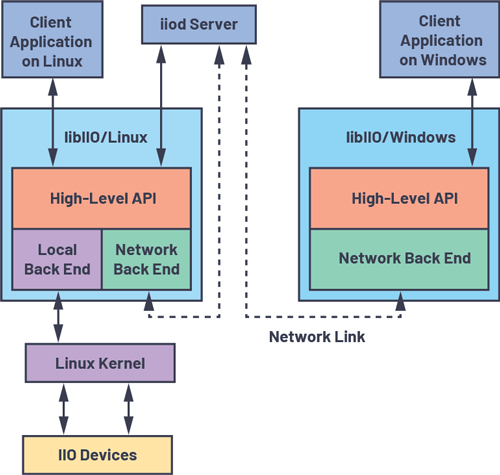
libIIO system outline using the network back end.
Utilizing the Arm processor and PL generally happens at stages further along in the design flow, when the system is being optimized for deployment. Therefore, a common entry point for developers initially will involve connecting remotely to the embedded system from a workstation.
When running Linux on the embedded system, running code remotely or locally on a workstation is a relatively transparent process due to how the infrastructure was designed. This is primarily due to an open library called libIIO.
libIIO is an interface library that allows for a simplified and consistent access model to different device drivers built within the Linux IIO framework in the kernel. This library is at the core of what makes using the CbM platform so flexible and provides the functionality for data streaming and device control.
libIIO itself is broken into two main components. The libIIO library is a C library for accessing different IIO driver properties or functions that includes streaming data to and from devices like ADCs, DACs, and sensors.
The IIO daemon called iiod, which is responsible for managing access between the libIIO library, or clients using the library and the kernel interface to the actual drivers.
The libIIO and iiod are themselves written from different components that allow for different methods of access to the drivers in what are called back ends. Back ends allow control and dataflow for libIIO from local and remote users, and, since they are componentized, new back ends can be added into the system. Currently there are four back ends supported with libIIO:
Local: Allows for access of locally accessible drivers for hardware connected to the same machine.
USB: Leveraging libusb, this back end allows for remote control of drivers across a USB link.
Serial: Provides a more generic interface for boards connected through serial connections. UART is the most common use.
Network: The most used remote back end, which is IP based for access to drivers across networks.
The system-level overview shows how the components of libIIO would be used and how they fit into an overall system. On the left of the diagram is the embedded system, which has the libIIO library installed and runs the iiod daemon. From the embedded system, users have access to the local back end and even the network back end. In their code they could switch between both with a single line change to address either back end. No other changes to the target code are required.
The left-hand side of the diagram represents a remote host, which could be running any operating system. There are official packages for Windows, macOS, Linux, and BSD. In the diagram the network or IP-based back end is utilized, but this could also be a serial, USB, or PCIe connection. From a user’s perspective, libIIO can be leveraged from the C library itself or many of the available bindings to other languages including: Python, C#, Rust, MATLAB, and Node.js. Providing a significant amount of choice for users that need to interface with different drivers from their applications.
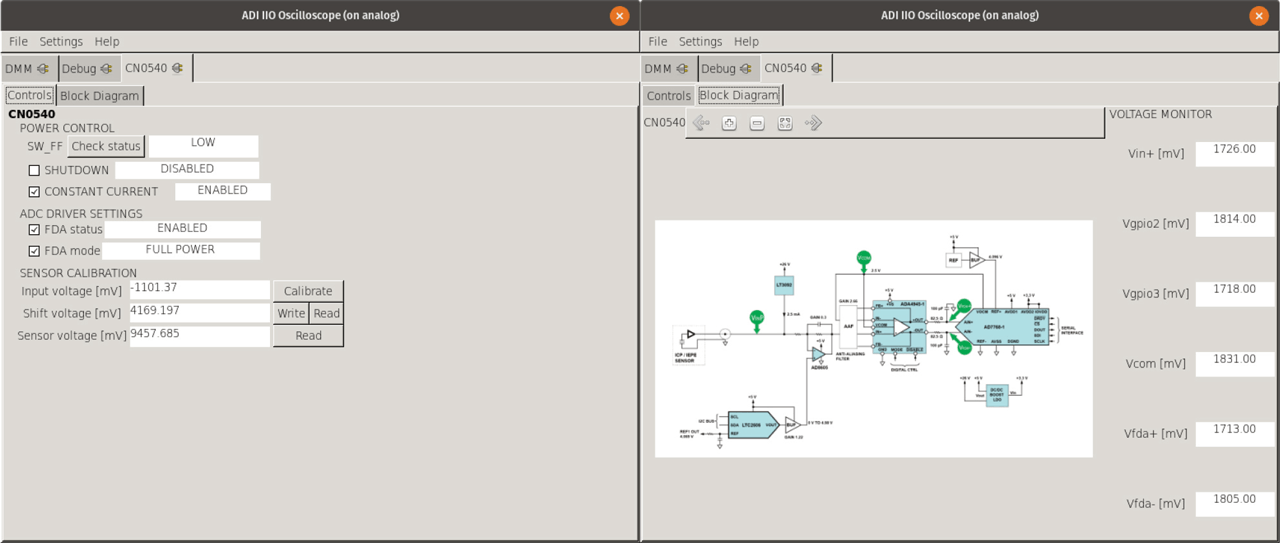
Software tools aid development.
Applications and tools
When getting started with a new device, using libIIO directly is generally not recommended. Therefore, many higher level applications exist that are built on top of libIIO that provide basic configurability for any IIO device from the command line and in GUI format. These are the IIO Tools and IIO Oscilloscope, respectively.
The IIO Tools are a set of command line tools that ship alongside libIIO and are useful for low level debugging and automatic tasks through scripting. For example, for lab testing it can be useful to set up the platform in different sample rate modes and collect some data. This could be easily done with a few lines of bash or through a batch script leveraging the IIO Tools.
However, the most common entry point for users is the GUI application IIO Oscilloscope, typically referred to as OSC. OSC, like the IIO Tools, is designed to be generic to allow control of any IIO driver, and, since it’s based on libIIO, it can be run remotely or on the board itself. However, it also contains a plugin system where specialized tabs can be added for specific drivers or combinations of drivers.
The figure above shows the plugin tabs loaded automatically for CN0540-based boards, including the controls and monitoring tabs. These tabs provide an easy interface to access the low level functionality of the CN0540’s ADC, DAC, and control pins, as well as a basic diagram of the data acquisition board and test point monitoring. There is further OSC documentation available on the Analog Devices Wiki if you wish to learn about the other default tabs and plugins available.
The final important aspect of OSC is the capture window. The capture windows provide plotting capability for data collected from ADCs or any libIIO-based buffer. A capture window is used in Frequency Domain mode, where the spectral information of the data is plotted. Other plots, including time domain, correlation, and constellation plots, are available. This is useful for spot checking a device, debugging, or during the evaluation process. The plots include common utilities like markers, peak detection, harmonic detection, and even phase estimation. Since OSC is also open source, it can be extended by anyone to add more plugins or plots, or even modify existing features.
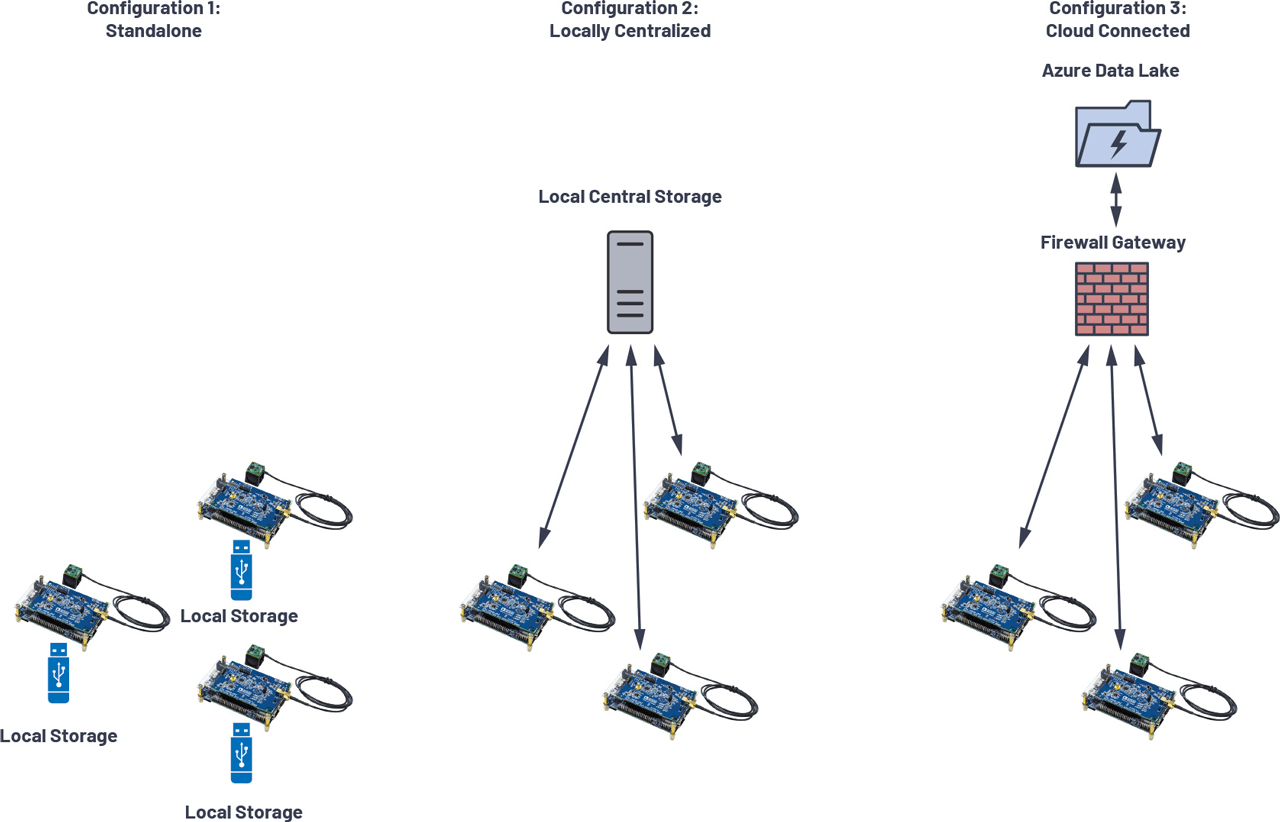
CbM network topologies
Algorithm development environment
So far, we have covered the core low level tools where most engineers start when first using the CN0549. These are important to understand first so developers can understand the flexibility of the system and the different choices or interfaces they can utilize. However, after getting a baseline system up and running, developers will want to quickly move the data into algorithmic development using tools such as MATLAB or Python. Those programs can import the data from the hardware. Additional control logic can be designed when necessary.
In the context of a machine learning development cycle, there is usually a common flow that developers will follow independent of their desired software environment for working with data. An example of this process is where data is collected, split into testing and training, a model or algorithm is developed, and finally the model is deployed for inferencing in the field. For real services, this overall process is continually performed to introduce new learnings into production models. Tools like TensorFlow, PyTorch, or the MATLAB Machine Learning Toolbox work with this process in mind. This process makes sense but usually the effort in collecting, organizing, and the complex task of managing the data can be overlooked or completely ignored. To simplify this task, an associated software ecosystem was designed with these tools and packages in mind.
Python integration
First, starting in Python, device specific classes for the CN0549 are available through the module PyADI-IIO. A simple example of configuring the device’s sample rate and pulling a buffer over Ethernet is provided where there are no complex register sequences, obscure memory control calls, or random bits to memorize. That is managed for you by the driver, libIIO, and PyADI-IIO running on the board itself, remotely on a workstation, or even in the cloud.
PyADI-IIO, which is installable through pip and conda, exposes control knobs as easy to use and documented properties. It also provides data in commonly digestible types like NumPy arrays or native types and will handle unit conversions of data streams when available. This make PyADI-IIO easy to add to environments like Jupyter Notebook, and to easily feed data into machine learning pipelines without having to resort to different tools or complex data conversions—allowing developers to focus upon their algorithms, not some difficult API or data conversations.
MATLAB integration
On the MATLAB side, support for CN0549 and its components are provided through the Analog Devices Sensor Toolbox. This toolbox, like PyADI-IIO, has device specific classes for different parts and implements them as MATLAB System Objects (MSOs). MSOs are a standardized way that MathWorks authors can interface to hardware and different software components, and provide advanced features to assist with code generation, Simulink support, and general state management. Many MATLAB users likely utilize features of MATLAB that are implemented as MSOs without knowing, such as scopes or signal generators.
In using the CN0532 interface and a DSP Spectrum Analyzer scope, both of which are implemented as MSOs, again like PyADI-IIO, there is a friendly interface for traditional MATLAB users.
Beyond hardware connectivity, the Sensor Toolbox also integrates with the code generation tools for HDL and C/C++. These are great tools for developing, simulating, and deploying IP, even for those who are unfamiliar with HDL design or tooling but understand MATLAB and Simulink
Using TensorFlow
There are several examples provided with the CN0549 kit from basic data streaming to a machine learning classification example. Machine learning for time series data, like vibration data from CN0532, can be approached from a few different perspectives. This can include support vector machines (SVM), long short-term memory (LSTM) models, or even autoencoders if the data is interpreted directly as a time series. However, in many cases it can be more convenient to transform a time series problem into an image processing problem and leverage the wealth of knowledge and tools developed in that application space.
Let us look at this approach in Python. In one of the examples provided with PyADI-IIO, several measurements were taken by mounting the CN0532 to an oscillating fan. This was done at different settings for the fan (Sleep, General, Allergen) and, in each mode, 409,600 samples were captured. When examining this data, the time domain for the Allergen case is easily identified but the other two cases are more difficult to distinguish. These might be identifiable by inspection but having an algorithm identify these cases may be error prone in the time domain.
To help distinguish the use cases better, the data was transformed into the frequency domain and spectrograms were used to plot the concentration of different frequencies over time. The spectrograms have a much starker difference in the data and are consistent across the time dimension. These spectrograms are effectively images and now can be processed using traditional image classification techniques.
Splitting the dataset into training and testing sets, the spectrograms were fed into both a neutral network (NN)-only model with three dense layers and a smaller convolutional neural network (CNN) model. Both were implemented in TensorFlow and able to converge easily to near 100% test validation in under 100 epochs. The CNN converged in about half the time with roughly 1% the tunable parameters, making it by far the more efficient design. A training convergence plot of accuracy vs. epoch outlines the fast convergence of the CNN.
Edge to Cloud: moving into an embedded solution
Once a model is created, it can be deployed for inferencing purpose or decision making. With the CN0549, this could be placed on a remote PC where data is streamed from the CN0540 or directly run on the embedded processor. Depending on the implementation, placing the model within the processor will require more engineering effort but can be an order of magnitude more power efficient and will be able to operate in real-time. Fortunately, over the last several years there has been tremendous development growth in tools and software for deployment of machine learning models.
Leveraging FPGAs
Both Xilinx and Intel have high level synthesis (HLS) tools to translate high level languages into HDL code that runs on the FPGA. These will usually integrate with Python frameworks like TensorFlow, PyTorch, or Caffe to aid with model translation into IP cores—allowing engineers to deploy IP to either the DE10-Nano, Cora Z7-07S, or custom system.
These IP cores then would be stitched into the open HDL reference designs provided by ADI. In the design, data from the CN0540 is read through the SPI pin, and the 24-bit samples are interpreted by the SPI engine and passed to the DMA controller into memory. Any DSP or machine learning model could be inserted into this pipeline directly in the datapath.
Utilizing microprocessors
Instead of converting the algorithms to the HDL layer, they could instead be run directly in the Arm core. Depending on data rates and complexity of the algorithms, this is a reasonable development path and typically much more straightforward.
Developing C code or even Python for the Arm core will take considerably less development resources and time than HDL and is usually easier to maintain. Tools like MATLAB Embedded Coder can even streamline this process and automatically convert MATLAB to embeddable and optimized C code for the Arm core. Alternatively, TensorFlow has tools like TensorFlow Lite that are embeddable C versions of their Python libraries to allow for simpler transitions toward an embedded target.
Smart decision-making topology
Condition-based monitoring is not a one size fits all space for hardware and software, which is why the CN0549 was designed to be flexible. When we consider problems like anomaly detection for CbM, it can usually be approached from two time scales: one where we need to react immediately, such as in a safety-related scenario, or on a long-term time scale more related to maintenance or equipment replacement. Both require different algorithms, processing power, and approaches.
As a machine operator in the ideal case, we would have a large data lake to train our models from, and both handle short-term detections without nuisance events, as well as stream data continuously from running equipment for future maintenance projections. However, for most operators this is likely not the case and the data lakes are more like dry riverbeds.
It also may be difficult for some off the shelf solutions to perform data collection given security concerns, physical locations, networking, or topology requirements. These difficulties drive the need for more custom solutions.
CN0549 is a standalone system with several connectivity options. Since it runs standard Linux, traditional networking stacks like Ethernet and Wi-Fi work out of the box and it is even possible to connect cellular modems if needed. In practical applications, there are a few typical topologies that standout.
One configuration is the offline collection case, which can happen at remote sites or where connectivity to the internet is just not possible. In this case large storage media will coexist with the platform and is manually collected on a schedule. Alternatively, the other two options stream data to a common endpoint.
Another configuration is an isolated network that could be internal only to the organization, or just a cluster of platforms in a remote location that centrally collect data. This may be required for security concerns or just lack of connectivity. The setup is easy for any of these configurations and could be customized for an end deployment’s specific needs.
A final configuration is a direct cloud option where each platform directly accesses the internet and pushes measurement to the cloud. Since the CN0549 runs on Linux, the platform can leverage APIs for different cloud vendors like Microsoft Azure IoT or Amazon IoT Greengrass easily from languages like Python—creating an easy avenue to start building a data lake for the newly connected equipment.
When there is consistent connectivity between the cloud and local process, different algorithms can be split as we have discussed between what needs or can to run locally and what can be run in the cloud. This will have natural trade-off between requirements on processing power for algorithm complexity, latency to events, and bandwidth limitations on what can be sent to the cloud. However, since it is so flexible these factors can be easily explored.
Conclusion
The CN0549 CbM platform provides system flexibility and software resources to designers when developing their applications. A deep dive into the software stacks has been provided with discussions around how the different components can be leveraged for CbM and predictive maintenance (PdM) developments.
Due to the openness of the software, HDL, schematics, and integrations with data science tools, designers can leverage the components they need for their end system throughout the entire stack. In summary, this condition monitoring design offers an easy to use out-of-the-box solution, complete with open-source software and hardware, to provide flexibility and allow designers to achieve better, customized results in less time.

